

How I Learned to Stop Worrying and Love the Market
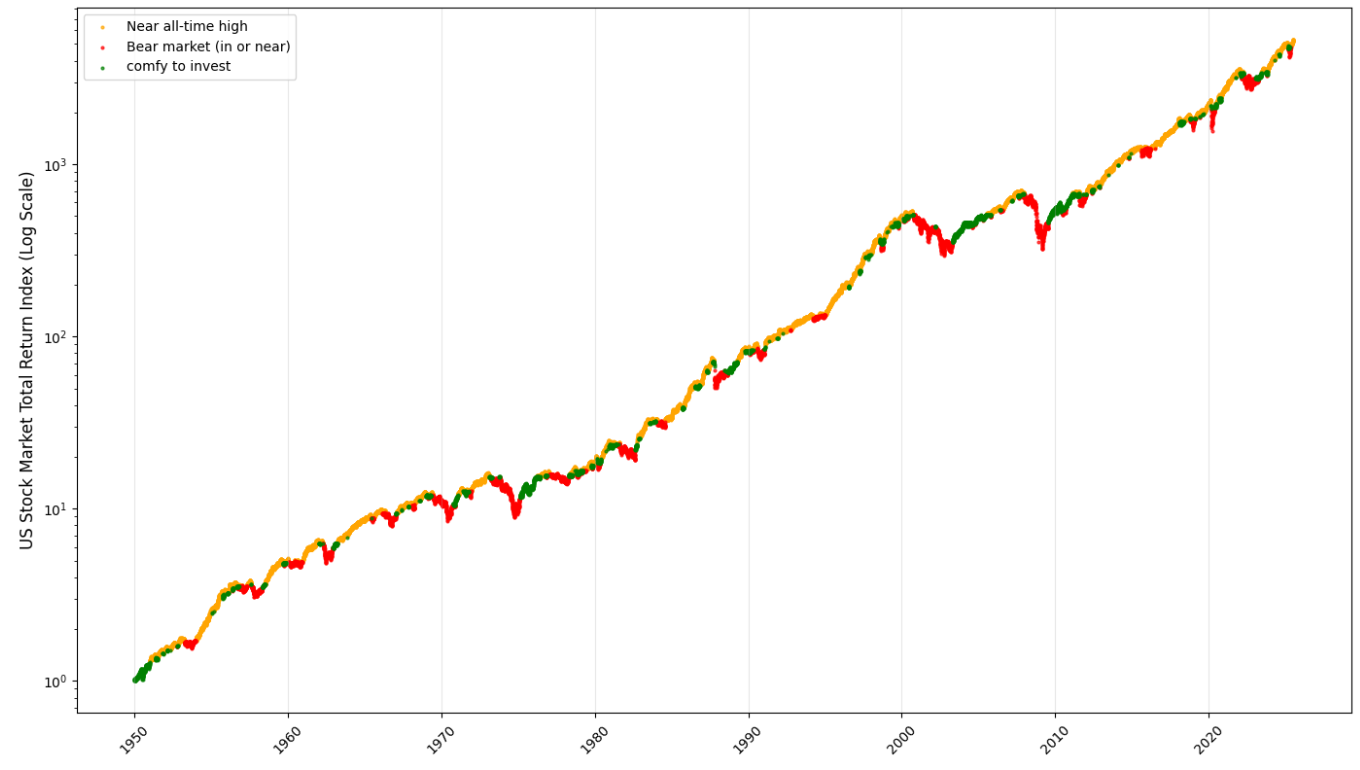
When is a good time to put more of your savings into the stock market?2 This question stresses us out because for as long as most of us can remember, the market has usually been in one of two states, neither of which feel great for putting our hard-earned money into the market. Either the market is at or approaching an all-time high, which can make it feel risky to invest, or it’s heading south, which can feel even worse. The chart below confirms this impression. Over the past 75 years, the US stock market was within 5% of its all-time high about 60% of the time (the orange segments), and then another 25% of the time the market was in or near a bear market (the red segments) as signaled by the market trading below its one-year moving average. That leaves only 15% of the time for periods when it would have felt comfortable, using these criteria, to invest in stocks (the green segments).
A better lens
The metrics above reflect how investing in the stock market often feels to us, but using them to invest in stocks only during the few-and-far-between “green” periods is not wise on either theoretical or historical grounds. Perhaps a better way of thinking about how much to invest in the stock market is to base your decision on the long-term expected return of stocks relative to safe assets. If stocks are offering 3% or more over safe asset returns, most sizing frameworks, including the Merton share that we are particularly fond of, would suggest buying stocks in order to maintain a significant fraction of your wealth in them.
In the chart below, we see that US stocks offered a 3%+ excess expected return about 70% of the time. This is in stark contrast to the mere 15% of the time when the market was “comfortably” neither near its high nor flashing “bear market.”

Of course, exactly how much you want to have in stocks, given their return and risk, depends on your personal circumstances and degree of risk aversion.
Alas, neither lens makes US stocks look good today
We’re afraid that neither of the charts above are flashing green right now. We’re in one of those unusual times when US stocks look scary from both perspectives: the US market is close to an all-time high, and expected excess returns are rather low at about 1.5%. For most investors, today’s conditions may justify keeping US stock exposure relatively modest. However, there are still markets where expected returns appear more attractive, specifically in non-US stocks. See our Elm capital market assumptions for more details on the current state of global stock market expected returns.
A plan you can stick with
We hope you find this alternative perspective based on forward-looking excess expected return helpful (and stress reducing) as you consider putting money to work in stock markets today and in the future. In the end, the goal is not to avoid every bump in the road, but to have a plan that helps you stay the course. A plan starting with a thoughtful view anchored in long-term expected returns, rather than short-term sentiment, can help all of us stay invested and make better decisions across a wide range of market environments.
This is not an offer or solicitation to invest, nor are we tax experts and nothing herein should be construed as tax advice. Past returns are not indicative of future performance.
Throughout we use “stocks” and the “stock market” interchangeably to refer to broad-market equity exposure, not the purchase of individual stocks.
Interested in more like this?
Subscribe to our mailing list and get notified about new Elm news and research.